Templates
Infographics
Flow Chart Presentation Templates for Google Slides and PowerPoint Presentation
Flow Chart Presentation Templates for Google Slides and PowerPoint Presentation


Flow charts are a great way to simplify complex ideas and show the step-by-step process of how something works. They turn long, confusing explanations into easy-to-follow visuals that make understanding a lot quicker.
Whether you’re explaining a business process, outlining a project, or mapping out a decision-making flow, flow charts help make the information clear and organized. They break down each stage, so your audience can follow along without feeling overwhelmed.
If you’re looking to create a flow chart for your next presentation, using a ready-made flow chart template can save you time and effort. With Flow Chart Presentation Templates for Google Slides and PowerPoint, you get visually appealing and professionally designed layouts that are ready to be customized.
These templates are perfect for anyone who wants to quickly create a flow chart that looks polished and delivers the message clearly. Let’s see how it’s done.
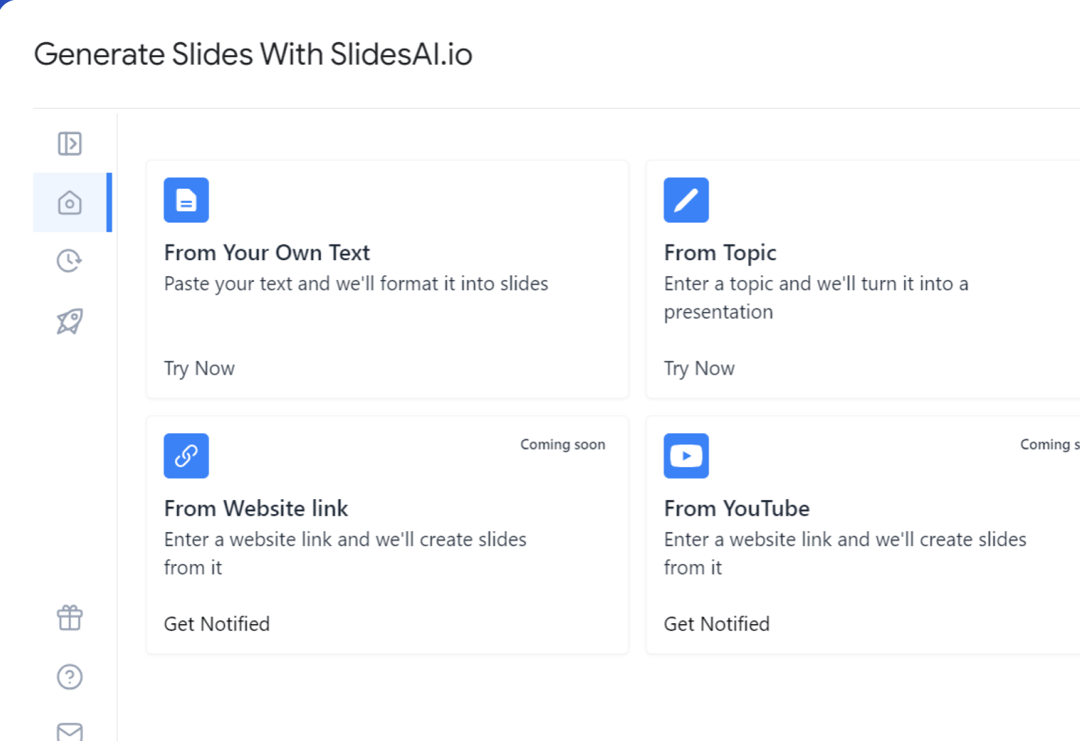
Create presentation slides with AI in Seconds in Google Slides
15M+Installs
Works with Google Slides
What is the Flow Chart Template?
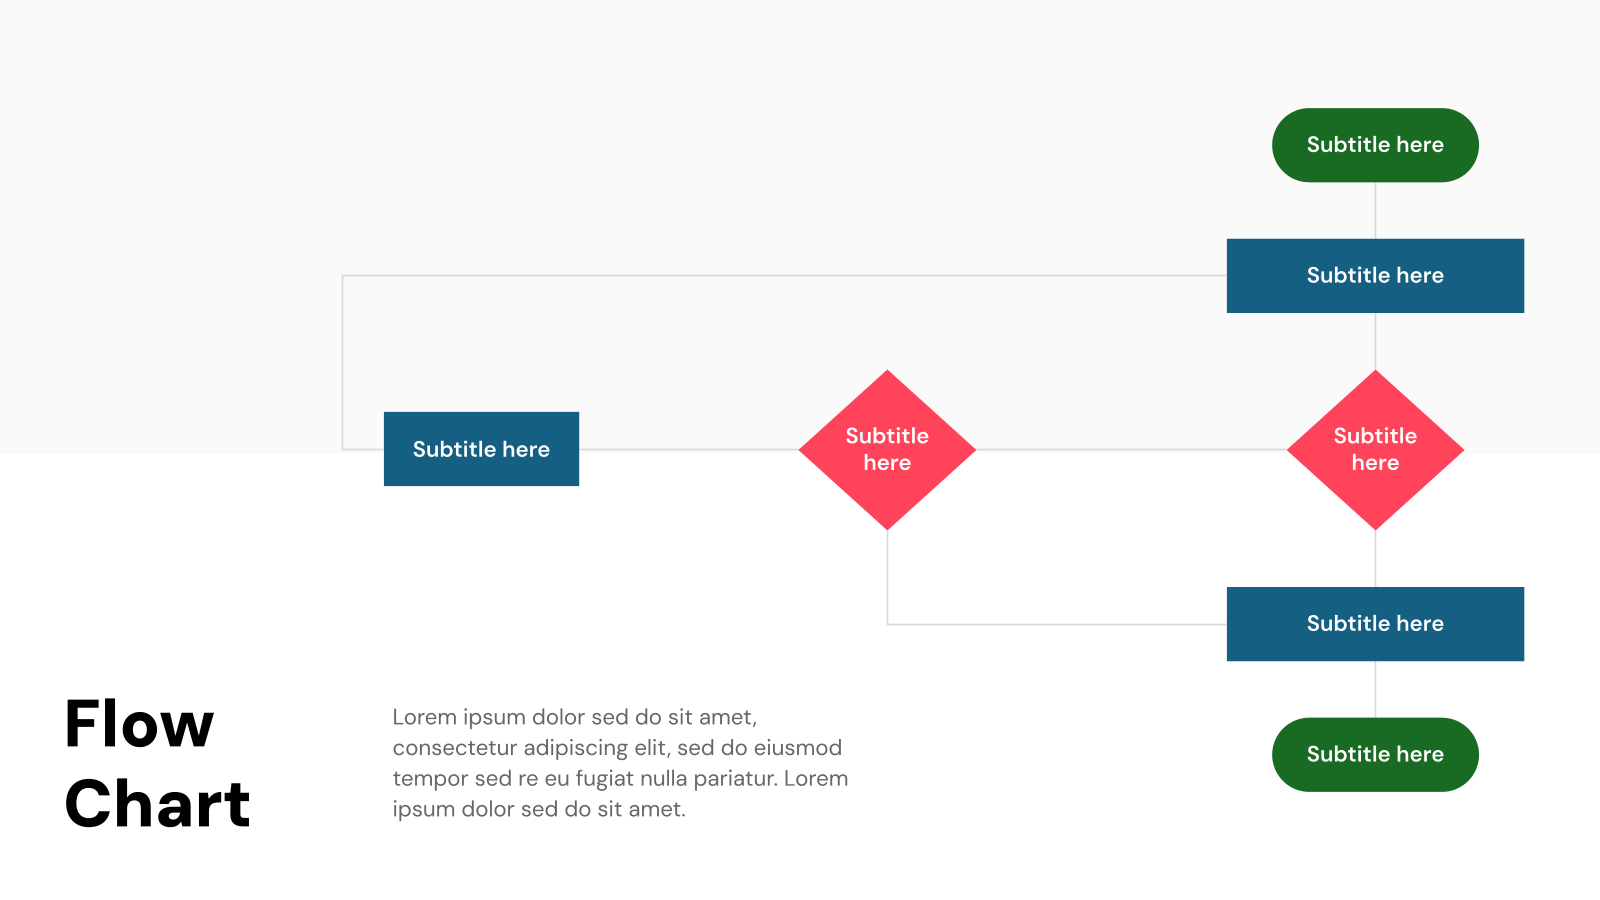
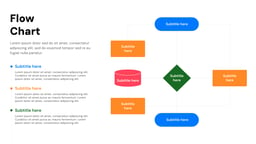
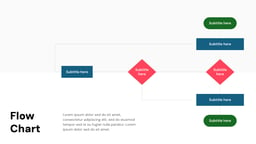
A flowchart is a visual representation of a process, showing each step in a clear and organized way. It uses different shapes to represent actions, decisions, or outcomes, all connected by lines and arrows to indicate the order in which things happen. This makes it easy to understand how a process flows from start to finish.
A flowchart template provides a structured format for creating these diagrams, helping users outline processes without starting from scratch. It can be used in various fields, from business and education to engineering and project management. By following a flowchart, anyone can understand a process quickly, identify areas for improvement, and ensure tasks are completed in the correct order.
How Flow Chart Presentation Templates Are Used?
- Business Processes: Companies use flow charts to outline workflows such as supply chains, order processing, or internal operations. This helps in spotting delays, reducing unnecessary steps, and improving overall efficiency.
- Decision-Making: Flow charts break down decision-making processes into clear steps. They help outline options, possible outcomes, and next steps for things like project approvals, troubleshooting, or customer service responses.
- Project Management: Teams use flow charts to illustrate project timelines, task dependencies, and deliverables. This makes it easier to assign responsibilities and track progress throughout the project lifecycle.
- Marketing and Sales Funnels: Businesses map out customer journeys, advertising strategies, and sales processes to understand how leads move through different stages. This visual representation helps improve planning and outreach strategies.
- Education: Teachers and trainers use flow charts to explain difficult concepts, historical events, or scientific processes. By breaking down information into smaller steps, students can follow along more easily and retain information better.
What Makes SlidesAI’s Flow Chart Templates Stand Out?
Creating a well-structured flowchart presentation from scratch can be time-consuming. SlidesAI simplifies this process with ready-made templates that help you organize your ideas clearly and professionally. Here’s what makes these templates a great choice:
- Ready-to-Use Templates: Instead of building each slide from the ground up, SlidesAI provides pre-designed templates that save time and effort. You can focus more on refining your message rather than worrying about layout and formatting.
- Full Customization: Even though the templates provide a structured layout, you still have complete control over how they look. You can adjust fonts, colors, layouts, and other design elements to align with your style or branding.
- AI-Assisted Editing: SlidesAI uses AI technology to help format and structure slides effortlessly. On Google Slides, you can enter your content, and the AI will automatically arrange it into well-organized, visually appealing slides with appropriate fonts and layouts.
- Uniform Design: A consistent look across all slides makes presentations more engaging and easier to follow. With built-in themes and color palettes, these templates ensure a cohesive visual style without extra design work.
- Polished and Professional Appearance: Not everyone has the expertise to create visually appealing slides from scratch. With SlidesAI’s templates, even those without a design background can produce clean, polished, and well-structured presentations with minimal effort.
How to Use Flow Chart Templates?
- Microsoft Powerpoint: Click on Download > Click on “PowerPoint” > Click on the downloaded file to make a copy and start customizing/editing the template
- Google Slides: Click on Download > Click on “Google Slides” > Click on “Use Template” to make a copy and start customizing/editing the template
Create presentations in seconds. Enter text and SlidesAI creates customizable slides based on that text in seconds that goes well with all our templates too
Tips for Flow Chart Presentation Slides
Design Tips
- Pick the Right Layout: The way you arrange your flowchart should match the type of information you are presenting. If the process follows a step-by-step sequence, a horizontal layout works best. For structures with multiple levels, such as organizational charts, a vertical arrangement is more suitable.
- Keep It Uncluttered: Too much information in one space can make a flowchart hard to follow. Use a clean and simple design with enough spacing between elements. This keeps the chart easy to read and visually balanced.
- Use Uniform Shapes and Colors: Maintain consistency by using the same shapes for similar elements. For example, use rectangles for steps in a process and diamonds for decision points. A uniform color scheme helps make the chart look more organized and visually appealing.
- Add Icons or Graphics: Incorporating relevant icons or small illustrations can make your flowchart more engaging. Visual elements help convey meaning quickly and make the chart more intuitive for the audience.
- Introduce Steps with Animations: Instead of displaying everything at once, consider adding animations to reveal one step at a time. Simple effects like “fade in” or “appear” allow viewers to focus on each stage without feeling overwhelmed.
Content Tips
- Make Each Step Clear: Label each part of your flow chart in a simple and direct way. Keep text short and avoid putting too much information in each shape.
- Use Actionable Words: Instead of general terms, try to use verbs that show an action, like “Start Process” or “Review Options.” This makes it easier for people to follow along.
- Highlight Important Decisions: Make decision points stand out by using different shapes or colors. This helps to draw attention to the most critical moments in the flow.
- Ensure a Logical Order: Arrange the flow chart steps in a clear sequence. Make sure there is an obvious beginning and end, and use arrows to guide the viewer through the process.
- Include Brief Notes: If needed, add short speaker notes or captions to provide extra information. Just be sure not to crowd the slide with too much text.
Technical Tips
- Use Built-in Flow Chart Tools: Both PowerPoint and Google Slides have built-in shapes and connectors specifically for flow charts. These tools help you position elements accurately and maintain consistent spacing throughout your chart, making your design cleaner and more organized.
- Align and Distribute Elements: Make sure everything is lined up properly by using the alignment and distribution features. This will help your flow chart look neat and balanced, creating a more professional presentation.
- Optimize for Accessibility: When designing your flow chart, make sure the text is big enough to read easily, and that the colors contrast well. This is particularly important if your presentation is being viewed on a screen, where poor visibility can make it harder for people to follow along.
- Save as a Template: Once you’ve designed a flow chart, save it as a template for future use. This will save you time on upcoming projects, allowing you to quickly update and customize the design without starting from scratch.
- Test on Different Devices: Before finalizing your presentation, check how it looks on different devices. This ensures that your flow chart remains readable and looks good, whether it’s being viewed on a desktop, tablet, or phone.
Create presentation slides with AI in Seconds in Google Slides
- No design skills required
- 3 presentations/month free
- Don’t need to learn a new software
Install SlidesAI
Works with Google Slides
Frequently Asked Questions (FAQs)
What’s the best font to use for flow chart presentation slides?
Use simple, legible fonts like Arial, Calibri, or Helvetica. Ensure that the text is large enough to be easily read on all devices.
How can I ensure my flow chart is aligned properly in PowerPoint or Google Slides?
Use the alignment tools available in both PowerPoint and Google Slides (under “Arrange” > “Align”) to neatly align and distribute elements.
How can I add icons to my flow chart in PowerPoint or Google Slides?
Both platforms allow you to insert icons from their built-in libraries (PowerPoint’s “Insert” > “Icons” or Google Slides’ “Insert” > “Image” for uploading icons) to enhance your flow chart’s visual appeal.
What’s the best way to organize a complex flow chart?
For complex flow charts, break them down into smaller sections or use layers to make the chart easier to follow. You can also use color coding or grouping similar steps together.


© This template can be used for both personal and commercial purposes. However, any form of reselling or redistribution of this template is strictly prohibited.


Create Presentation Slides with AI in seconds
Design stunning, unique slides with AI-generated visuals and text. Say goodbye to boring templates with our free AI presentation maker