
Flowcharts are important tools for business communication, helping to illustrate complex processes, ideas, and decisions. They allow teams to see workflows visually, spot where things might get stuck, and make operations smoother. Learning how to make a flowchart in PowerPoint can be really useful.
In simple terms, flowcharts show the steps in a business process or workflow. They help people understand what needs to happen and where there might be problems. Flowcharts are easy to share with teams, making them great for working together and making decisions.
This article will teach you how to create a flowchart in a PowerPoint presentation. Let’s get started.
What is a Flow Chart?
A flowchart is a visual tool that maps out the steps involved in a process, from start to finish. It uses shapes like rectangles and diamonds to represent actions, decisions, and other important points. This makes it easy to understand the overall flow of the process and identify any potential bottlenecks or areas for improvement.
Breaking Down the Concept of Flowchart
- Flow: This refers to the sequence of steps or actions that make up the process. Ideally, the flow should be logical and efficient.
- Chart: This is the visual representation of the flow, using symbols and arrows to connect the different steps. A well-designed flowchart should be easy to follow and understand.
Benefits of Using a Flow Chart
- Visual Clarity: Flowcharts provide a straightforward way to visualize complex processes and their sequence, making it easier for everyone involved to understand how things work and where improvements can be made.
- Instant Communication: Teams can use flowcharts to communicate effectively without the need for lengthy meetings. By simply laying out processes visually, team members can quickly grasp what needs to be done step by step, promoting efficiency and teamwork.
- Effective Coordination: For project managers and resource schedulers, flowcharts help organize tasks and resources efficiently. By mapping out processes and identifying potential issues, flowcharts prevent team overload and ensure smoother project management.
- Efficiency Increase:Flowcharts help streamline processes by highlighting essential steps and removing unnecessary ones. This helps teams work more efficiently, saving time and resources in the long run.
- Problem-Solving: Flowcharts break down complex problems into manageable parts, guiding users through a systematic approach to finding solutions. By ensuring all steps are considered, flowcharts minimize the risk of overlooking critical details, ultimately saving time and reducing costs.
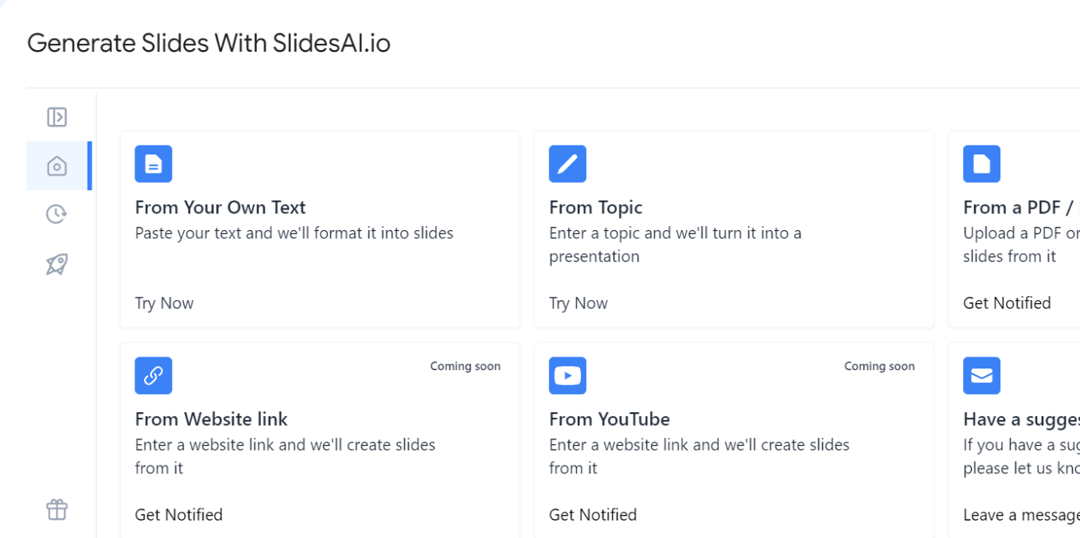
Create presentation slides with AI in Seconds in Google Slides
10M+Installs
Works with Google Slides
How to Create a Flow Chart in Powerpoint?
There are two main methods for creating flowcharts in PowerPoint, and the steps are similar regardless of whether you’re on a Mac or Windows:
Method 1: Using SmartArt Graphics
This is a quick and easy way to create professional-looking flowcharts with pre-designed templates. Let’s take a look at how it’s done:
Step 1: Insert SmartArt: Navigate to the “Insert” tab on the ribbon. Locate the “Illustrations” group and click the “SmartArt” button.
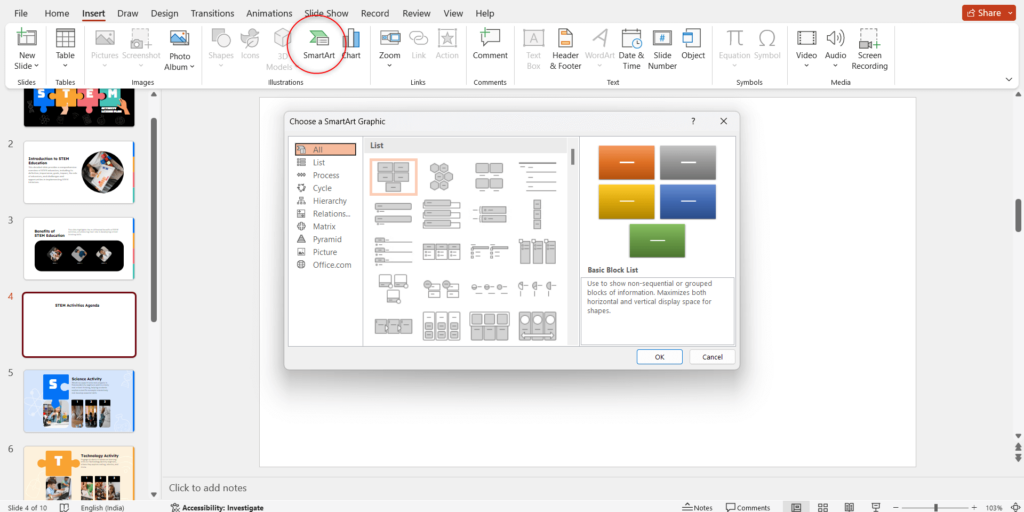
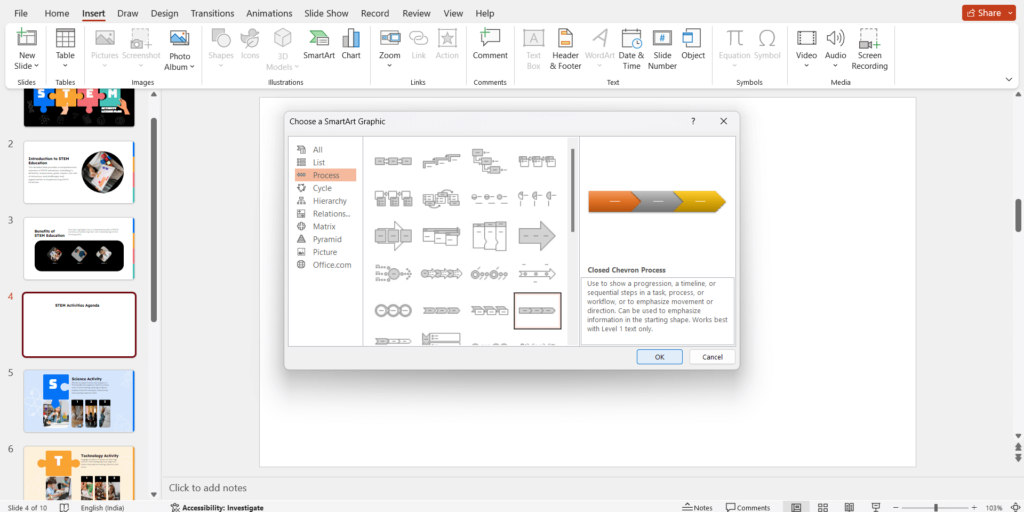
Step 2: Choose a Flowchart Layout: In the “Choose a SmartArt Graphic” window, select the “Process” category on the left. You’ll see various flowchart layouts on the right. Choose a layout that best fits your needs (e.g., Basic Bending Process, Accent Process). Double-click the chosen layout to insert it into your slide.
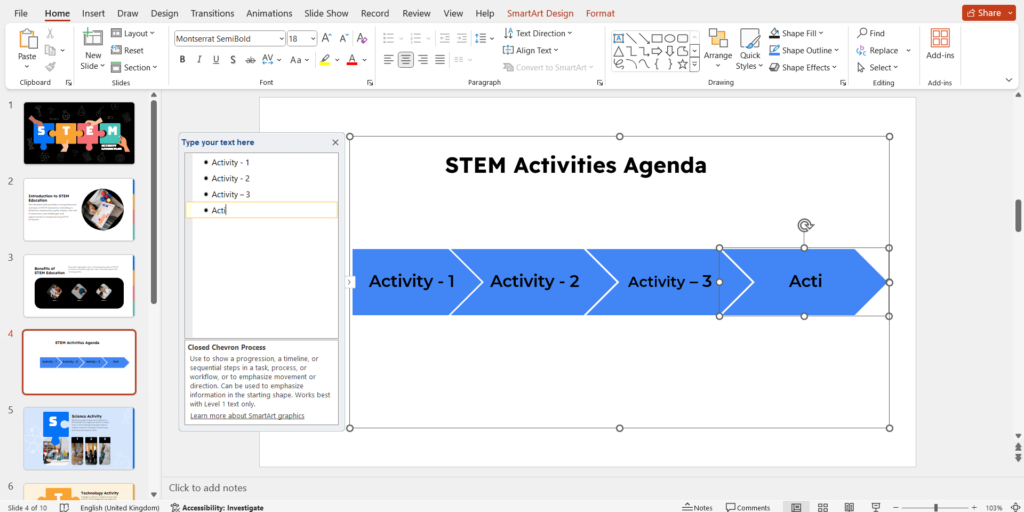
Step 3: Edit Text: Click on the “[Text]” placeholder within each shape of the flowchart. Type in the specific text for each step in your process. The text will automatically populate within the shapes.
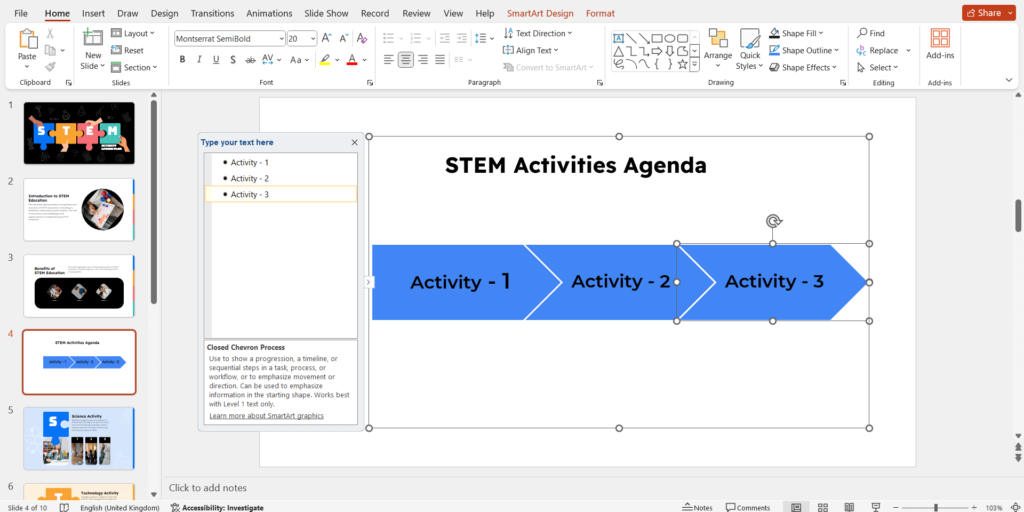
Step 4: Add or Remove Shapes: If you need to add more steps, click on an existing shape and then select “Add Shape” under the “Design” tab (visible when you click on the SmartArt graphic). Choose “Add Shape After” or “Add Shape Before” depending on where you want the new step. Similarly, you can right-click on an existing shape and select “Delete Shape” to remove it.
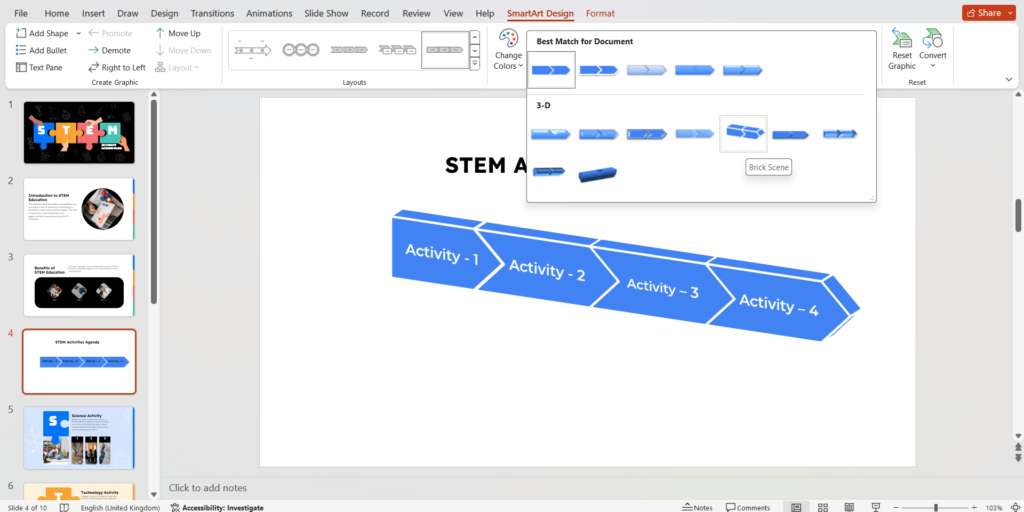
Step 5: Customize Appearance (Optional): The “Design” tab offers options to change the overall style and color scheme of your flowchart. You can also use the “Format” tab to fine-tune individual shapes (e.g., fill color, line style).
Method 2: Using Shapes Library
This method offers more flexibility in customizing the look of your flowchart. Let’s see how it can be used:
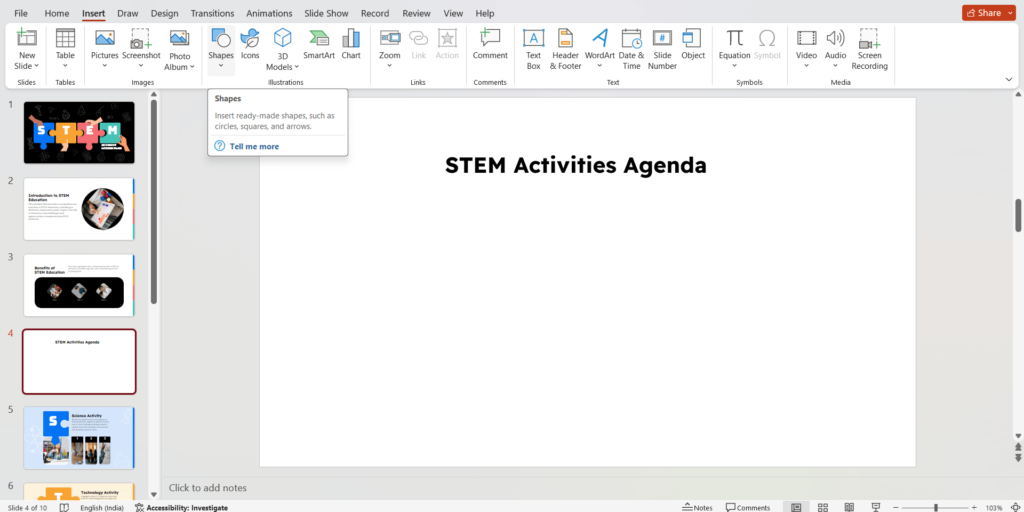
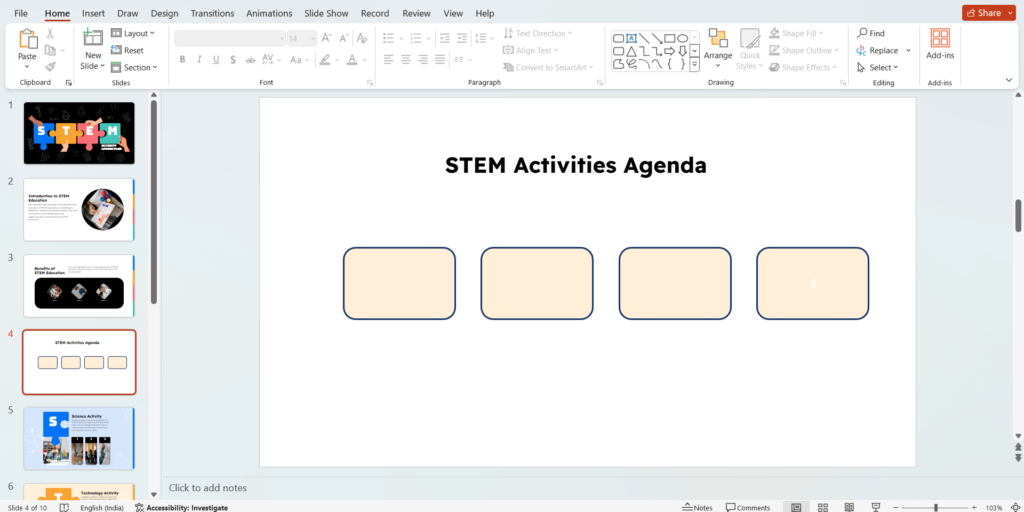
Step 1: Access the Shapes: Navigate to the “Insert” tab on the ribbon. Locate the “Shapes” button and click on it.
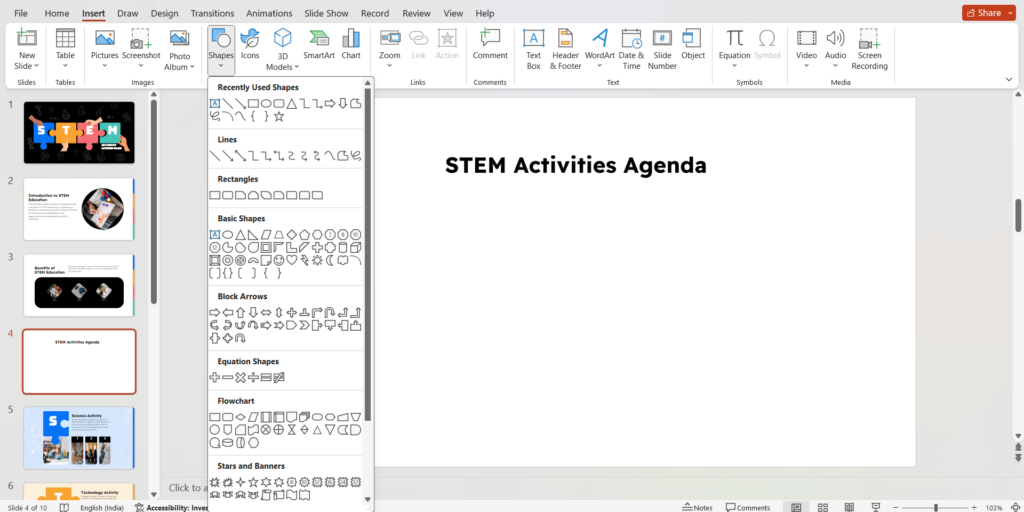
Step 2: Choose Flowchart Shapes: A dropdown menu with various shape categories will appear. Scroll down and look for the “Flowchart” section. This section will have a variety of shapes commonly used in flowcharts, such as rectangles (processes), diamonds (decisions), and documents (data input).
Step 3: Build Your Flowchart: Click and hold on to the desired shape from the “Flowchart” section. Drag your mouse to draw the shape onto your slide at the preferred size. Repeat this process to add more shapes for each step in your flowchart.
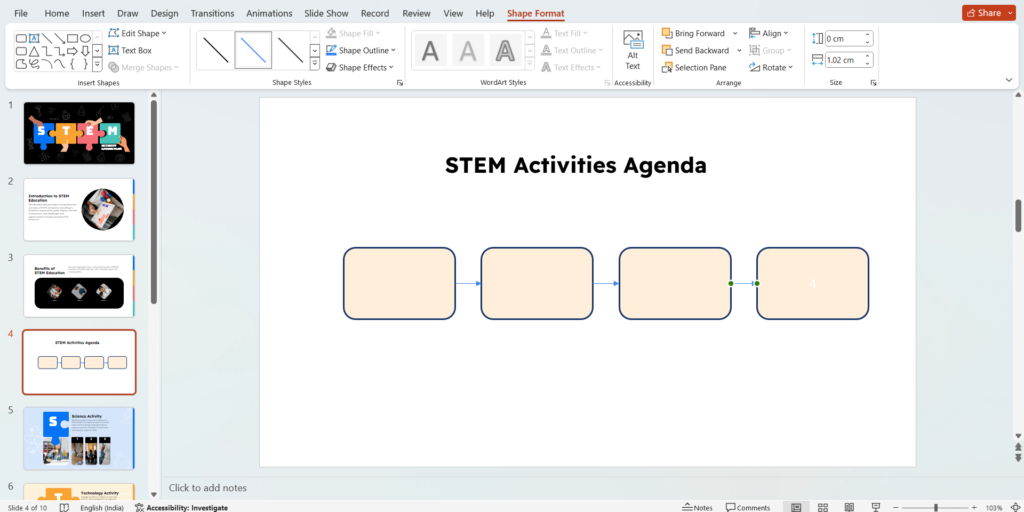
Step 4: Connect the Shapes: Click on the “Connector” button within the “Insert” tab. Choose the connector style you prefer (straight line, right-angle arrow, etc.). Click on the starting point (usually one corner of a shape) and drag your mouse to the endpoint (another corner of a shape) to connect them.
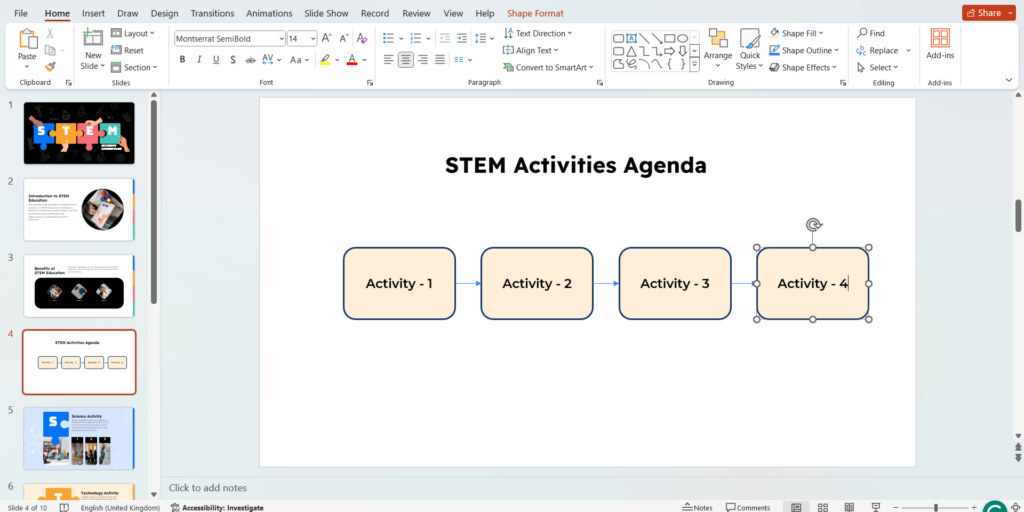
Step 5: Add Text: Click inside each shape you created. Type in the specific text for each step or description within the flowchart.
Format and Customize (Optional):
- Shape Formatting: Right-click on any shape and select “Format Shape.” This allows you to change the fill color, and line style, and add effects to individual shapes.
- Shape Arrangement: Use the “Arrange” options under the “Home” tab to stack, align, or group shapes for a more organized flowchart.
Create presentation slides with AI in Seconds in Google Slides
- No design skills required
- 3 presentations/month free
- Don’t need to learn a new software
Works with Google Slides
What Are Some Tips For Creating Clear And Effective Flowcharts?
- Use concise and clear text descriptions within shapes.
- Maintain a consistent flow from left to right or top to bottom.
- Avoid cluttering the flowchart with unnecessary elements.
- Consider using icons or images for visual interest.
Closing Thoughts
Flowcharts are a handy way to explain complex processes in a clear and easy-to-understand way. This guide has equipped you with the know-how to create your own flowcharts right in PowerPoint. Keep it simple, visually interesting, and focus on the key steps. By using flowcharts in your presentations and everyday work, you can help everyone stay on the same track, leading to smoother workflows, better decisions, and overall success.
Frequently Asked Questions
Which method is better, SmartArt or shapes?
SmartArt is quicker and easier for basic flowcharts. Where as Shapes offer more flexibility for complex or unique flowchart designs.
How can I share my flowchart with others?
You can export your PowerPoint presentation containing the flowchart to various formats (images, PDFs) for sharing.
Can I add animations to my flowchart in PowerPoint?
Yes! The Animation pane allows you to add animations to shapes and connectors, explaining complex processes step-by-step.